If you are a Marketer, you would have felt the need to predict or find out the probability
of consumers who would switch from your brand to another competing brand or would like to
find out the probability of how many customers would switch from another brand to your
brand.
In this post, I would like to share with you how you can do that.
You need to do the following
We would be using MS Excel for analysis, you can also use LibreOffice or Google Sheet for the same purpose as per your convenience.
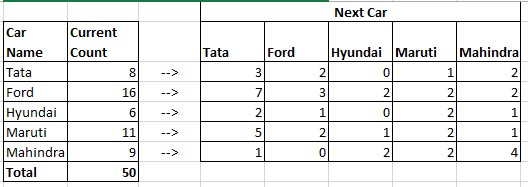
Tabulate the data in Excel as shown in the below image.
Cross tabulate the survey data in the following way:
As per Markov chain algorithm:
In this case
Formulate the corresponding matrix and find the steady state matrix in Excel.
As per this example’s sample data, we found Steady/Final state as
[0.36, 0.16, 0.10, 0.18, 0.2] corresponding to Tata, Ford, Hyundai, Maruti, Mahindra.
This means, There is 36% probability that the consumers would be using Tata Brand cars, 16% probability of using Ford Brand cars and so on.
You can download the excel sheet for this sample problem from below:
In this post, I would like to share with you how you can do that.
You need to do the following
- Conduct a survey.
- Use Markov Chain to calculate the respective probability.
We would be using MS Excel for analysis, you can also use LibreOffice or Google Sheet for the same purpose as per your convenience.
Step 1: Conduct a Survey
In this step, conduct a survey among a specified sample of consumers who are using
products of your and other competing brands. For example, if you would like to predict
the brand switching behavior of Cars, you can conduct survey among the car
users.
The questionnaire should contain the following 2 questions:
The questionnaire should contain the following 2 questions:
- What is the current car brand they are using?
- What is the next car brand they would prefer while they buy next car within a year?
Tabulate the data in Excel as shown in the below image.

|
|
| Car Brand Survey Data Tabulation Sample |
|
| Car Brand Survey Data Cross Tabulation |
Step 2: Use Markov Chain to calculate the respective Probability.
As per Markov chain algorithm:
[Initial State] x [Transition Probability] = [Steady State]
| Markov Chain Steady State Calculation |
In this case
- Initial State matrix consists of the proportion of current consumers who are using each of the car brands like Ford, Hyundai, etc.
 |
| Initial State Matrix |
- Transition Probability matrix shows the proportion of current consumers of each brand who would switch to other brand in the next 1 Year. For example in this case, Number of consumers who are using Tata and would like to switch to Ford is 3, i.e. a probability of 3/8 = 0.38.
| Transition Probability Matrix |
- Steady State matrix shows the proportion of the consumers who would be using the corresponding brands like Ford, Tata, etc.
Formulate the corresponding matrix and find the steady state matrix in Excel.
As per this example’s sample data, we found Steady/Final state as
 |
| Steady State Matrix |
[0.36, 0.16, 0.10, 0.18, 0.2] corresponding to Tata, Ford, Hyundai, Maruti, Mahindra.
This means, There is 36% probability that the consumers would be using Tata Brand cars, 16% probability of using Ford Brand cars and so on.
You can download the excel sheet for this sample problem from below:
DOWNLOAD EXCEL SHEET
I hope, it would this post would help you in predicting brand switching behavior in your
business for any kind of products.